Is your to-do-list cramped with buzzwords and ideas on how to accelerate your digital transformation? Well, according to WAN IFRA’s latest World Press Trends Outlook report, you are not alone – it is on top of news publishers’ 2021 priority lists.
The pandemic has accelerated the publishing industry’s race towards long-term digital transformation and digital reader revenue. However, the path towards digital reader revenue is neither simple nor happening overnight. Nevertheless, an important step in the right direction is getting to know your epaper readers, their needs, and behavioural patterns. Something Danish newspaper Dagbladet Børsen (Børsen) has been working with for several years.
How Børsen derives value from epaper user data

A first prerequisite to profiting from your epaper user data, is to have it condensed into something interpretable that you can act upon. A way to do this is by means of the Visiolink Engagement Studio dashboards, which Børsen installed across all their newsrooms during 2019.
Engagement Studio visualises Børsen’s raw data into easily interpretable dashboard figures, which are then benchmarked against Børsen’s defined KPIs. According to Head of Media at Børsen, Jørgen Andresen:
“The most interesting thing about these numbers, is that they tell us something about how our readers engage with and react to our epaper offerings. The numbers are easy to interpret and quickly offer anyone, anywhere in the organisation information about how our articles are performing.”
However, when talking to Børsen’s Head of Media, it also becomes very clear that there is no quick-fix when it comes to translating this knowledge into tangible actions with immediate impact on your user-engagement KPIs – it requires hard work and dedication.
Improving your epaper KPIs requires a committed after-critiquing process
Your epaper data offers an insight into how your content is performing in the eyes of your readers. What it does not tell you, is how to reach your KPIs, increase your digital subscription numbers and ultimately your digital reader revenue. According to Jørgen Andresen this means that your derived epaper data cannot stand alone.
“If you really want to learn from your Engagement Studio setup, you have to take it seriously and dedicate time to after-critiquing yesterday’s epaper. You cannot get around the fact that you have to make an active decision to learn from your data and this takes time,” he says.
At Børsen, they continuously seek to improve their KPIs by means of data-driven decisions and consequently undertake after-critiquing sessions every single day. During these sessions, yesterday’s epaper performance is discussed and analysed.
Amongst other things, Børsen looks explicitly at the characteristics of well-performing, as well as poor-performing articles. During this part of the process, Jørgen Andresen highlights the importance of being reflective when interpreting the outlined data:
“If for instance an article is performing well on total engagement time, but we know it to be three times the length of our average articles – is it then a well-performing article? Here, we would go on to discuss how far into the article our readers have gotten and based on this, dive further into what we can actually determine about its overall performance,” Jørgen Andresen reflects.
Thus, after-critiquing processes naturally lead to assumptions about what for instance distinguishes a well-performing article from a poor-performing one. It might have to do with different parameters – length, subject, form, graphics etc. – or any specific combination hereof. The only way to find out for sure, is by putting your hypotheses to the test.
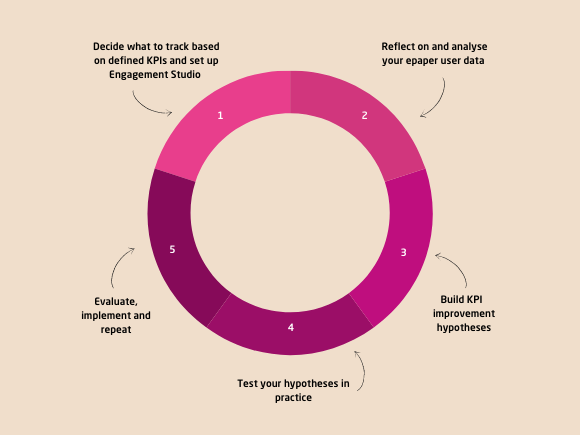
Fig. 1: How Børsen works with data tracking and analysis - a continuous process
After-critiquing naturally leads to hypotheses development and testing
Børsen managed to improve its epaper user-engagement significantly, by testing the relationship between push-messages and epaper openings. Jørgen Andresen explains how they had a theory that identifying their golden moment for push-messages would have a positive impact on their epaper opening-rate. They decided to test out this hypothesis in practice, by moving one of their regular push-messages back half an hour at intervals of two weeks, while keeping track of how this influenced the opening-rate. Their golden moment for push-messages ended up improving their epaper opening-rate by 10-15%. Jørgen Andresen further elaborates:
“Taking the time to after-critiquing yesterday’s epaper’s performance based on the data reported in the Engagement Studio dashboards is rewarding to the editorial process. It is rewarding in how it gives you an understanding of your readers’ reaction to your content but also in your work with ensuring that they keep being engaged and paying subscribers in the future.”
Want to learn more about how Børsen works with epaper user data tracking and analysis? Click here to read a previous interview with Jørgen Andresen, Head of Media.