Originally posted by visiolab.
Google Analytics is a highly versatile analytic service that can give important insights. At visiolab, our most important resource is knowledge, most of which comes from years of experience within the media industry. To ensure we continue to accumulate knowledge about the uses of e-papers, we use Google Analytics in the media industry and Applications designed for digital newspapers and magazines. On a daily basis, we receive live data feeds from more than 300 e-paper applications, all of which give us the insights we need to provide the best assistance to our clients.
The data allows us to establish media industry benchmarks – benchmarks that are based upon more than 40 m Openings and 75 m Downloads. These benchmarks give us the ability to see exactly how customers' digital newspaper and magazine solution performs compared to competitors.
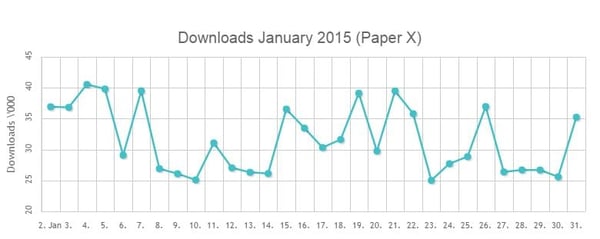
A few of the Google Analytics metrics have been customized to our use (i.e. Custom Variables and Page Path levels), which allow us to analyse interesting Application-specific data such as; App-Downloads, Viewing Orientation, Publication Dates of a Specific Newspaper and Archive Searches. The below graph shows the specific number of e-paper downloads in one month for one of our clients. Downloads is a useful metric when the overall performance of an online newspaper needs to be clarified over a given period of time.

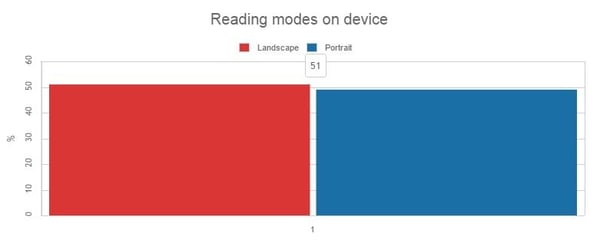
Another interesting metric to analyze is reading modes. When dealing with portable devices in an advertising context, reading modes and their actual use becomes important. This is especially true when dealing with the online newspaper. A full page ad in a printed newspaper will always remain as a full page. In digital newspapers and magazines, the size of the ad can be influenced by the physical use of the device on which it is being viewed. By setting up a custom event, it is possible to clarify this metric and retrieve data to support future decision making. In the below graph, the users of the online newspaper in question, engage with the e-paper through both reading modes more or less equally.

To sum up, visiolab has worked with Google Analytics to make it a fully functional tool within the context of online newspapers and continues to expand analytic capabilities with the implementation of Google Tag Manger in the near future.
If you want to learn more about reader behaviour you can download the FREE 2015 User Survey Benchmark Report.


