
Maybe you have heard about the forecast saying that the newspaper is dying – but that is not the case when it comes to the e-paper! When we look at the development of the e-paper consumption and the amount of people opening the app, we see a staggering increase!
To be more exact, we see that the opening of e-papers has almost doubled during the period from January 2017 until September 2020. The overall reason for this is simple: The popularity of the e-paper is increasing and media houses get more and more readers to their e-paper, which directly affects the opening rate:
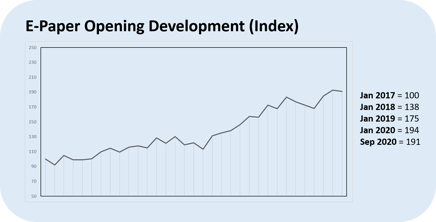
The steadily increasing popularity of the e-paper is a result of many things - e.g. that the content created in the e-paper has become more and more relevant. Also, the classic, written content is to a higher extend being supplemented with additional types of content like digitized crosswords and audio in the form of narrated articles or podcasts - just to mention a few. This also means, that besides getting more openings, the e-paper is getting more re-visits, which likewise supports the increased use of the e-paper over the years.
More time spent in the e-paper per session
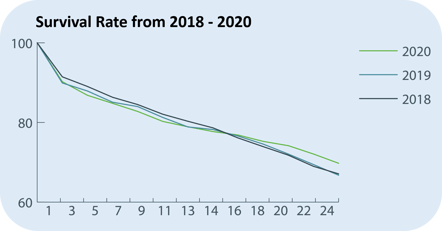
In addition to the growing usage, more readers are getting further into the e-paper than before. For instance, we looked at the percentage of readers reaching to page 23 during the last couple of years showing a slow but upward going tendency:
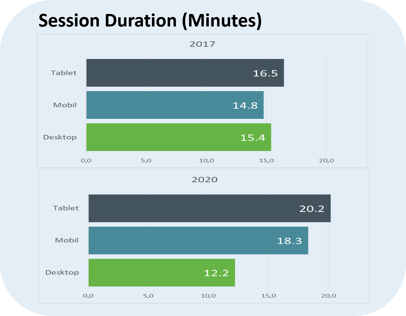
If we deep dive into the time spent in the app, it is evident that from 2017 and until today, the reader engagement level is higher than before as they spend more time reading the e-paper, which also can be explained through the more relevant content being published. In technical terms, this is called 'Session Duration'. When taking a further look at the distribution of Session Duration on the different platforms, we also se a clear pattern as the time spend on tablet and mobile have increased, while the time spent on desktop have decreased. The mobile has a more flat curve which indicates that the users open the e-paper throughout the day compared to tablet and desktop which to a greater extend are opened during the morning hours and again during the evening.
To get to the conclusions above, the Visiolink Business Intelligence team looked at 405 different titles in 10 countries across the Visiolink client base and compared their data from January 2017 until September 2020. Furthermore, the benchmark for the opening statistics was made on the basis of titles that have been Visiolink clients since 2015 in order to prevent misleading data from a new client that would cause the numbers to go up as a result of the news value. This means that the growth we have seen on the openings from 2017 up until now represents an organic growth and we anticipate a continuous increase of the usage of e-papers in the future.
Need any help with your data?
The Visiolink Business Intelligence team is always ready to help with your e-paper data. For any questions, enquiries or the like, please feel free to contact the team on bi@visiolink.com